Put the next boom where the plastic is collecting.
A monthly read of the bends, backwaters and shorelines along your reach where floating debris is piling up, flagged from satellite imagery. Early access.
High-resolution multispectral satellite imagery, no thermal
Schematic. A driftline of debris packing into the slack water on the inside of a bend, with a boom pencilled in across it.
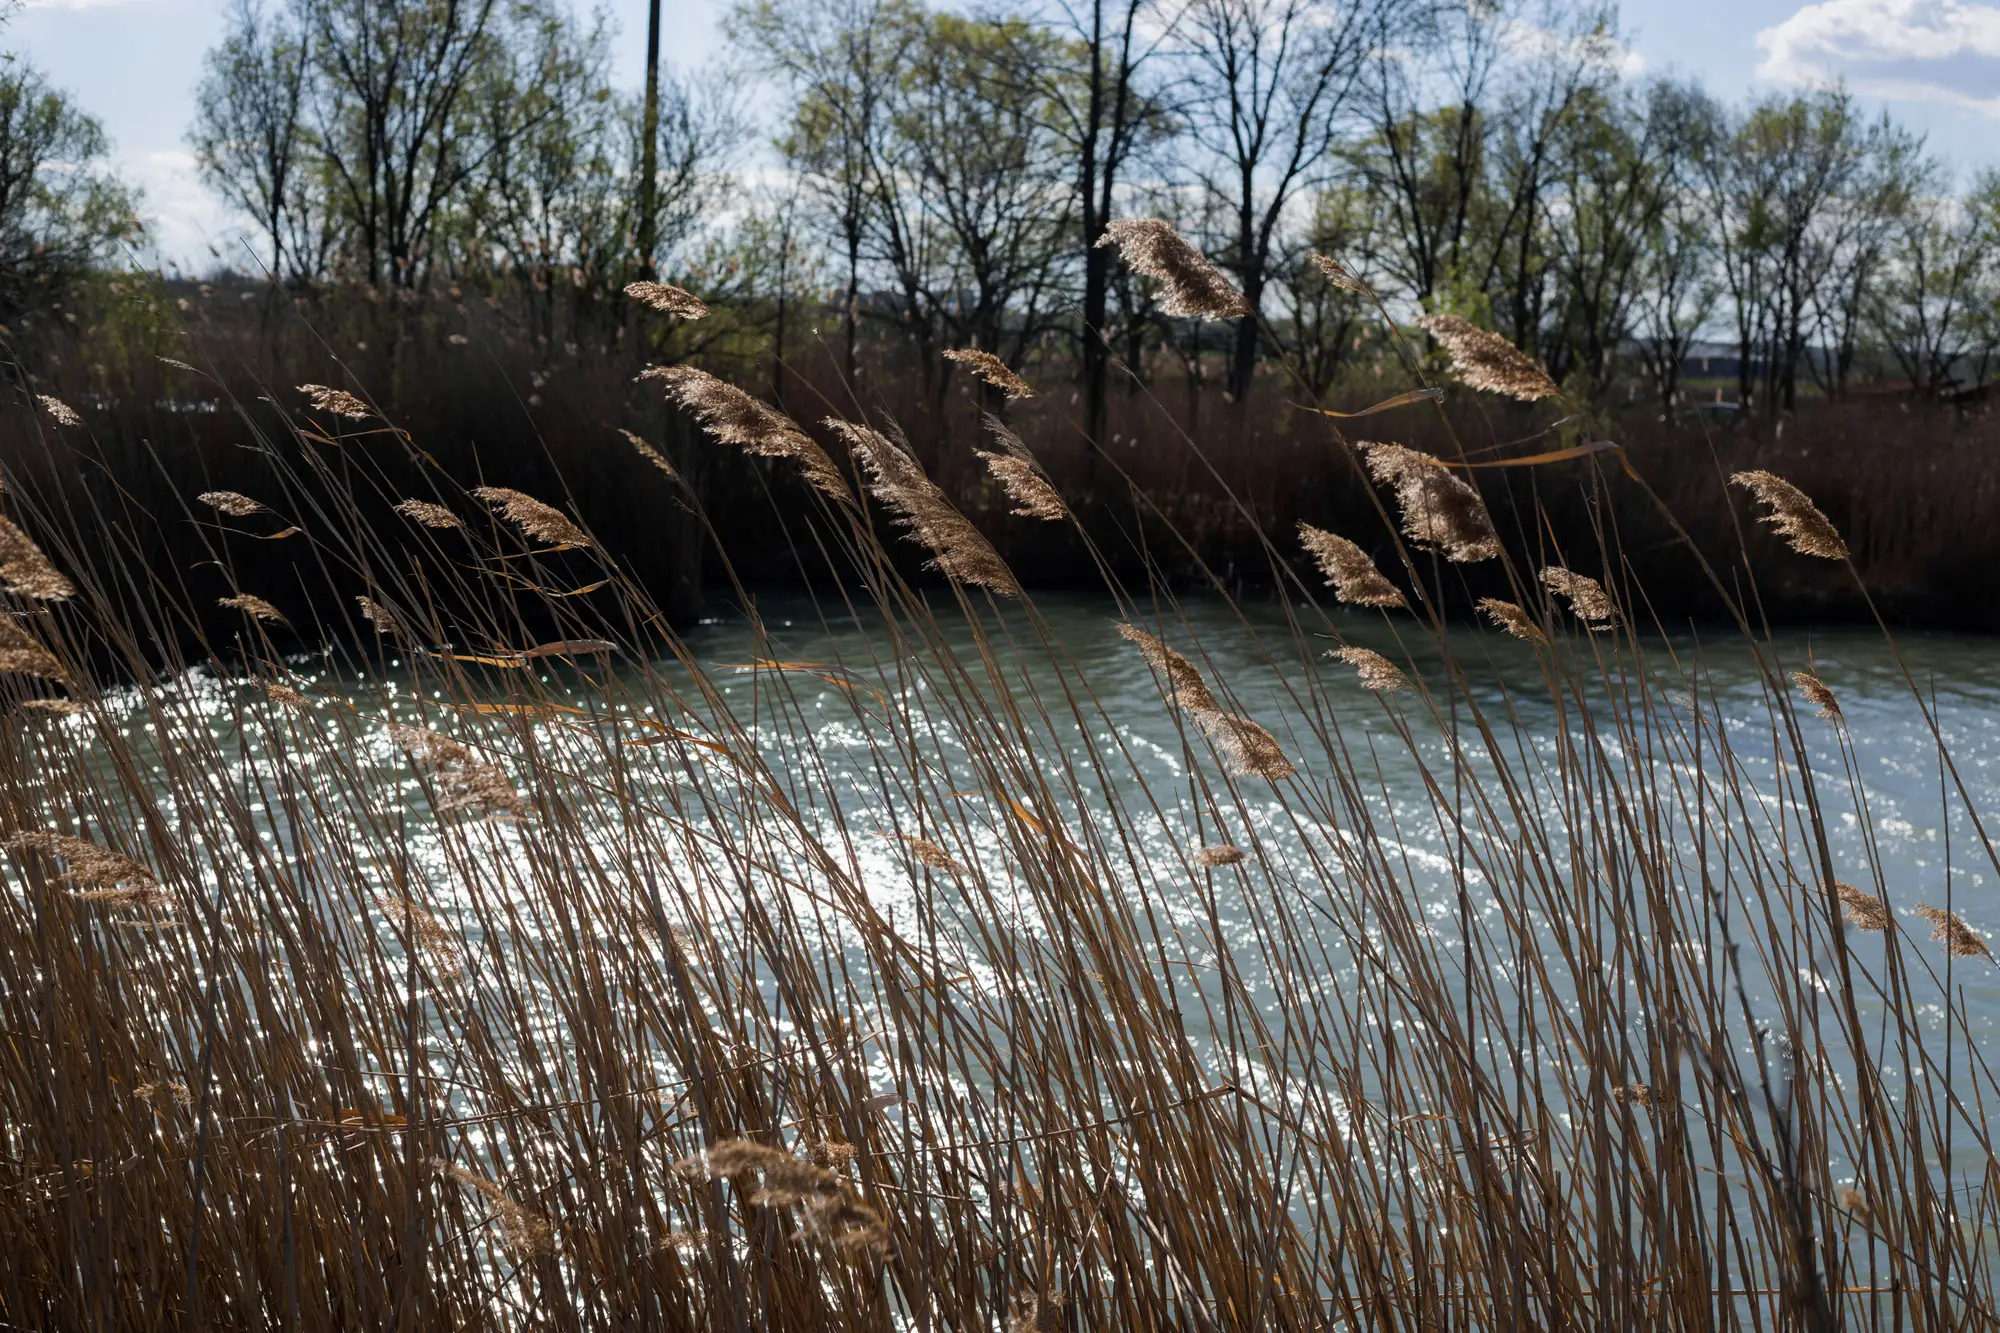
Plate I. Reeds on a lowland river bank in spring.
No. 01
How the next boom site gets chosen
You coordinate the cleanup programme for a river, or a stretch of coast, and the next interception point has to go somewhere. Boom money is tight, and the landowner will only let you place it once.
So you start from what you know. The bend below the weir where the debris stacked up after the last high water. The slack water the volunteers keep reporting on the weekend sweep. The place the crew lead says always fills. It is good knowledge, and most of it lives in three heads and a cleanup log. There is no dated look at the whole reach, and no one has been watching the backwater further down that started collecting debris this year.
So the new boom goes near the last cleanup, because that is where the evidence is. A season is spent emptying it. Meanwhile plastic keeps leaving the river past a site nobody knew to look at, and the funding report has to explain why the boom sits where it does.
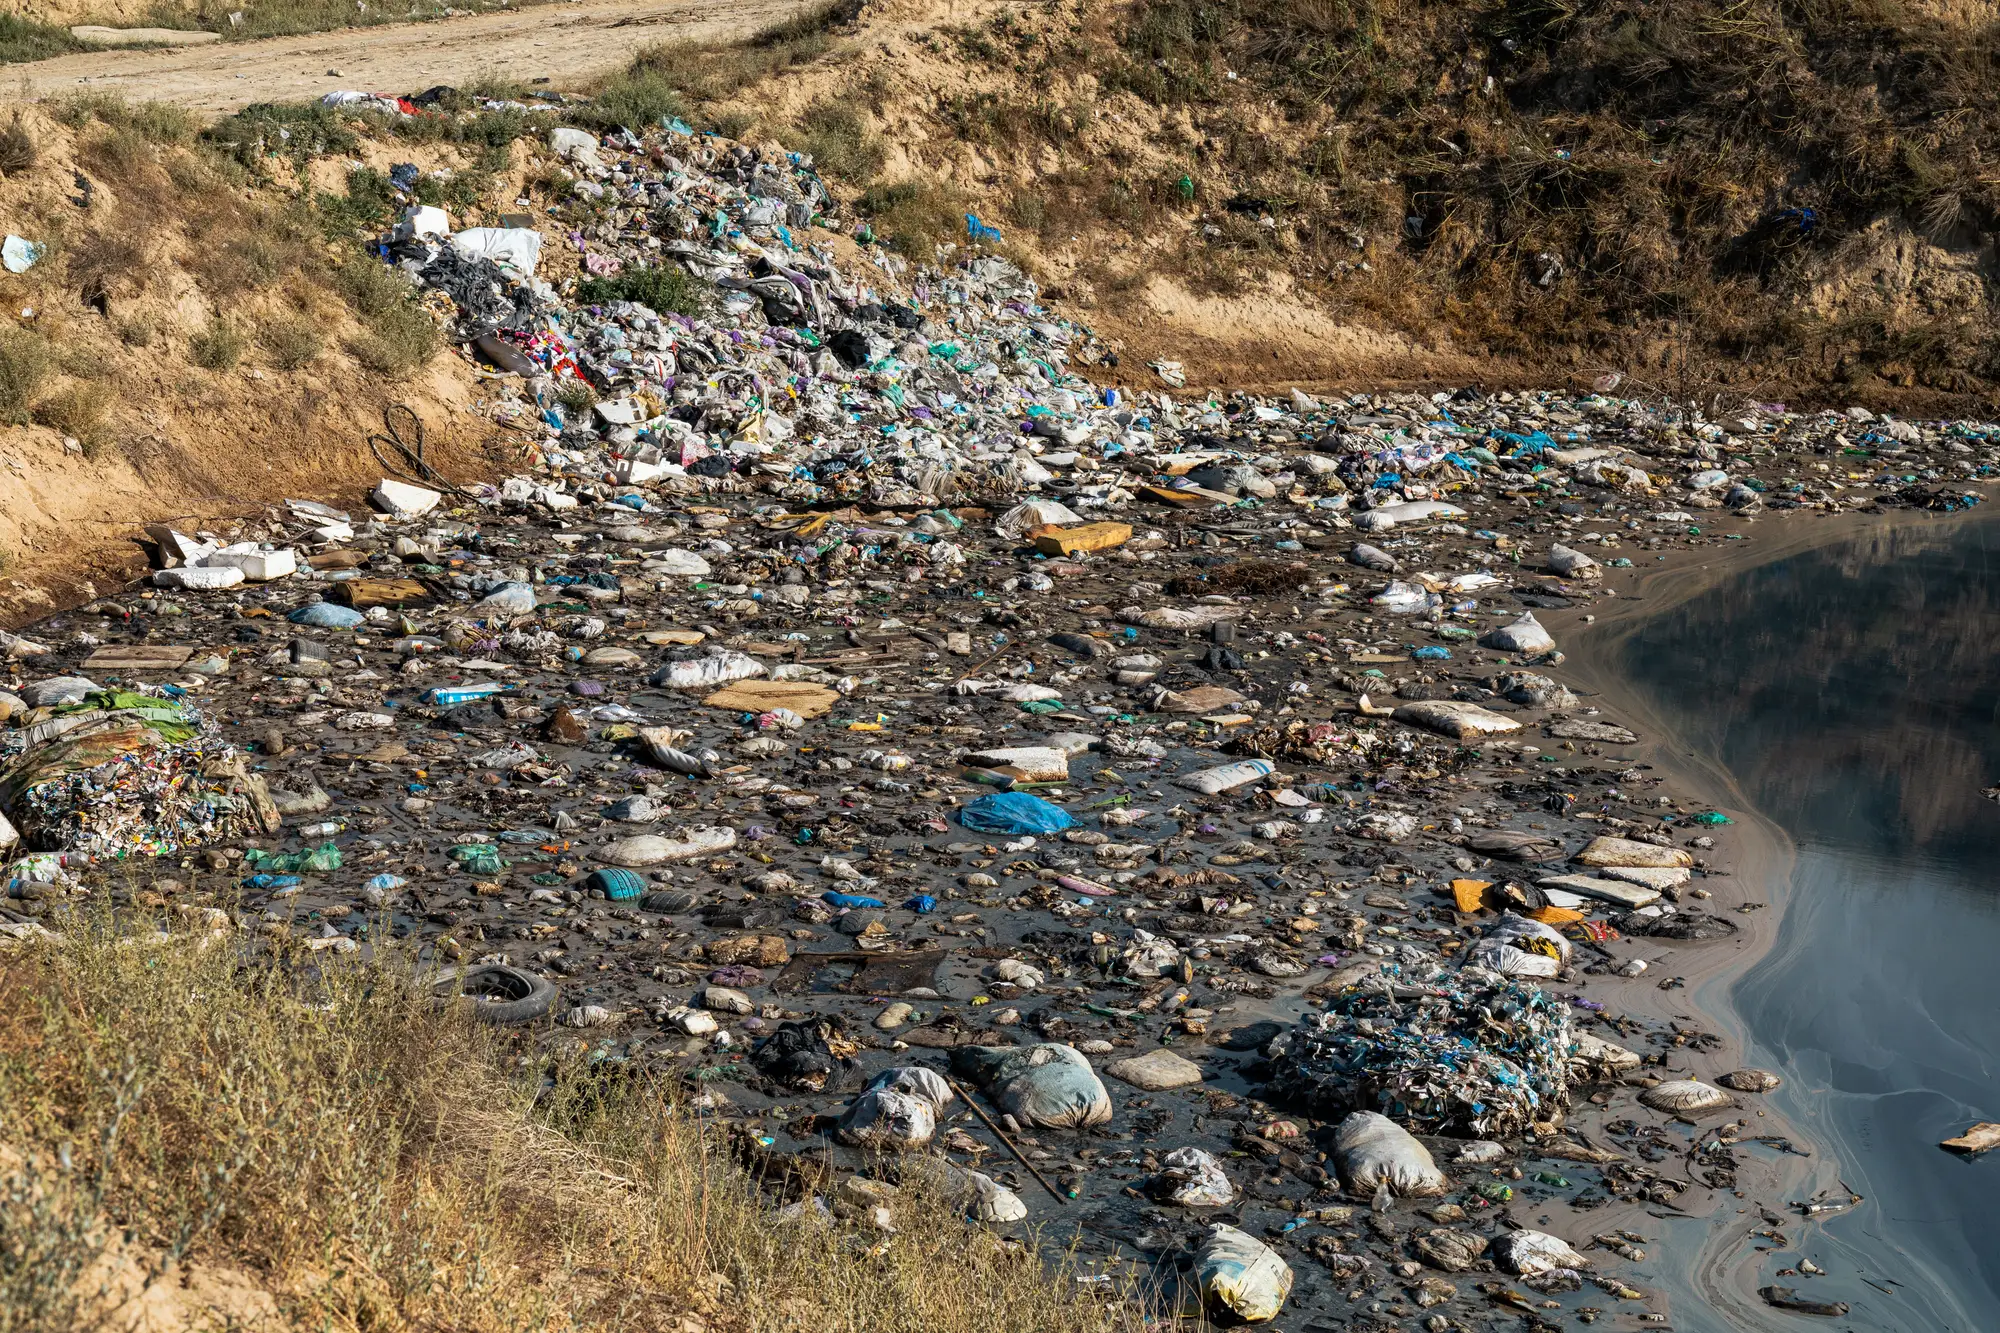
Plate II. Debris left on a bank where the current slackens. A photograph from the ground, for scale.
This page is about adding one thing to that process. Every month, a flagged list of where debris looks like it is collecting along your reach, so the sweep and the crew lead's memory have something to be checked against.
No. 02
What arrives each month
Because this is early access, the deliverables below are what we are shaping with the programmes that join early access, not a finished catalogue.
2.1
Accumulation-zone flag layer
GeoPackage or shapefile
One layer per month for your reach. Each flagged zone is a polygon along a bend, backwater, bank or tidal edge where the imagery shows a debris signature, with the date of the image it came from. It opens in QGIS or ArcGIS next to your own reach boundary and cleanup log.
2.2
Persistence note
PDF or CSV
Which zones keep flagging month after month and which appear once and clear. A zone that is there every month is a better candidate for a boom than one that showed up after a single flood.
2.3
Siting coordinate list
CSV
The flagged zones in order, with coordinates you can load into the crew boat's GPS or hand to the field lead before a sweep. Where a zone sits next to a bridge, weir or landing the list says so, as far as the imagery shows it.
No. 03
How it works
1
Send the reach
A reach boundary as a shapefile or GeoPackage, or the start and end of the river stretch or coast on a map. Say what you already run there: booms, traps, regular sweeps.
2
A monthly pass
For each month we pull the clearest multispectral image of the reach we can get. If cloud or glare covers a bend, that month's flag for it is left blank.
3
Flag the signature
Debris that collects at driftlines, bends and slack water has a look in the near-infrared bands that open water does not. Zones with that look are flagged and dated. A person checks the flags before they are listed.
4
Hand-over
The flag layer, persistence note and coordinate list, in formats that open in your GIS and on a phone.
5
Check it on the water
Send your sweep logs or photos from the same weeks and we set them beside the flags. That is how early access programmes find out where the flags are right and where they are not.
No. 04
Limits
These are the ways a satellite flag can mislead you.
L1
A flag is not a count
At 0.5–2 m, a pixel is bigger than a bottle. The imagery picks up patches, rafts and windrows of debris a few pixels across or more. Scattered litter, single items and plastic under the surface do not show.
L2
Floating mat, not proof of plastic
A debris raft is often vegetation with plastic caught in it, and foam, algae and sun glint can look similar. A flag means debris is likely collecting there. It does not tell you the share that is plastic.
L3
Cloud, turbid water and glare
Cloud hides the reach. Silt-heavy water and a bright sun on the surface can wash out the signal. Those months are blank for the affected bends, and we say so rather than fill them in.
L4
Monthly, and a target
Debris builds and clears over days to weeks. A monthly pass can miss a pile that formed and was lifted between two images, and the dates the images fall on are set by the satellite, not by you.
L5
Narrow channels
A small stream under trees or between high walls may be too narrow or too shaded to flag at all. Wide rivers, estuaries and open coast suit it best.
L6
Early access
This is a signal for siting decisions, still to be proved with programmes in early access. It does not replace a walk of the bank.
No. 05
Who it's for
Cleanup programme coordinators deciding where the next boom, trap or crew base should go on a river or coast.
Field leads who route boat and shoreline crews and want a dated starting point for each month's sweep.
Programmes that must show a funder or a landowner why an interception point sits where it does.
Who it's not for
Teams that need a count of items, a weight of plastic or a figure for tonnage removed.
Monitoring a single beach or pool where a walked survey is cheaper and finer.
Real-time or event response. A monthly flag cannot tell a crew where debris is today.
Compliance reporting on microplastics or water quality.
No. 06
Questions from programme coordinators
Does this map every piece of plastic?
No. It flags zones where debris appears to be collecting. It is not an item-level inventory and gives no count or weight.
What does 0.5–2 m resolution actually show?
Patches, rafts and windrows of floating debris, along with the bends and edges where they collect. Individual bottles and bags are smaller than a pixel.
Why monthly and not continuous?
Accumulation zones build and clear over weeks, so one look a month is enough to see which places keep filling. It is a target cadence, and cloud can delay a month.
What about cloud and muddy water?
Both can hide the signal. A bend with no usable image that month is left blank, not guessed at.
Has it been checked against ground crews?
Not yet, and we publish no accuracy figure. Early access exists to do that checking, and we would set the flags beside your own sweep records for your reach.
Which formats does it come in, and can it go into our GIS?
Layers open in QGIS and ArcGIS, and the coordinate list is a CSV. If you use another format, tell us when you ask for access.
Who owns the data we receive?
Use and ownership terms for the delivered layers are agreed before anything is delivered. The public and commercial imagery behind them keeps its own licence.
How is it priced?
We have no price to quote on this page. Early access terms are agreed with you directly once you have described your reach.
Tell us your reach and join the early access list.